Combiner Measurement Test Setup
The measurement configuration used in the "Combiner Comparisons" section are detailed here.
Baseline Setup
An HP8590B Spectrum Analyzer with Tracking Generator (TG) is used to provide a reference signal and to measure combiner response across the spectrum.
To emulate two separate antennas, the TG output will be connected to one splitter in a standard "downstream" splitting mode. This produces two RF sources of phase and amplitude that are conceptually identical. While I have not measured phase response, I have compared loss response of each port of a number of splitters, and from manufacturer to manufacturer they do vary. For these tests I chose a Radio Shack Model 15-1234 "Hybrid Splitter Combiner", which is actually among the better performing splitters I've measured. [Its response is almost identical to a Pico Macom MS-2D, which causes me to wonder if Pico Macom is actually the manufacturer].
First, we set some reference levels. Here is the initial setup, with TG Output connected to the Analyzer Input.
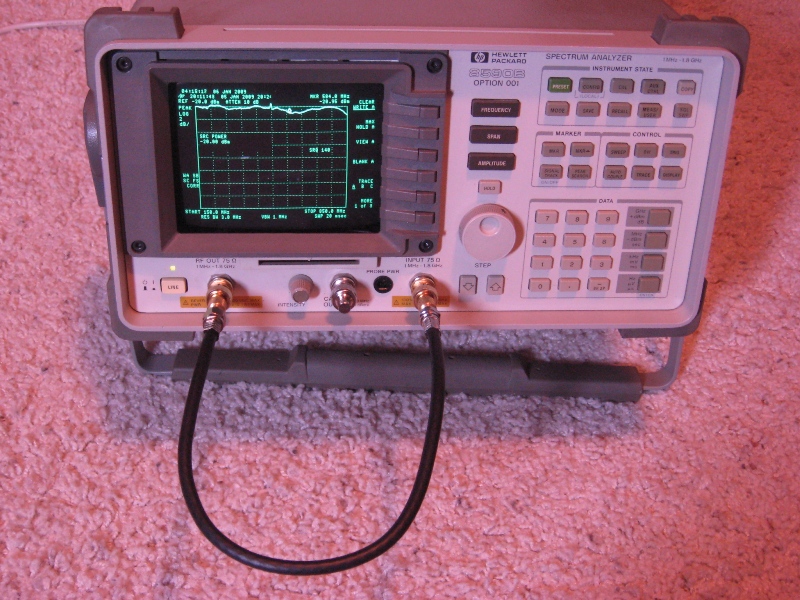
The TG output and Spectrum Analyzer reference levels are set to -20dBm, and Start/Stop frequencies are set to 150MHz and 850MHz, respectively.
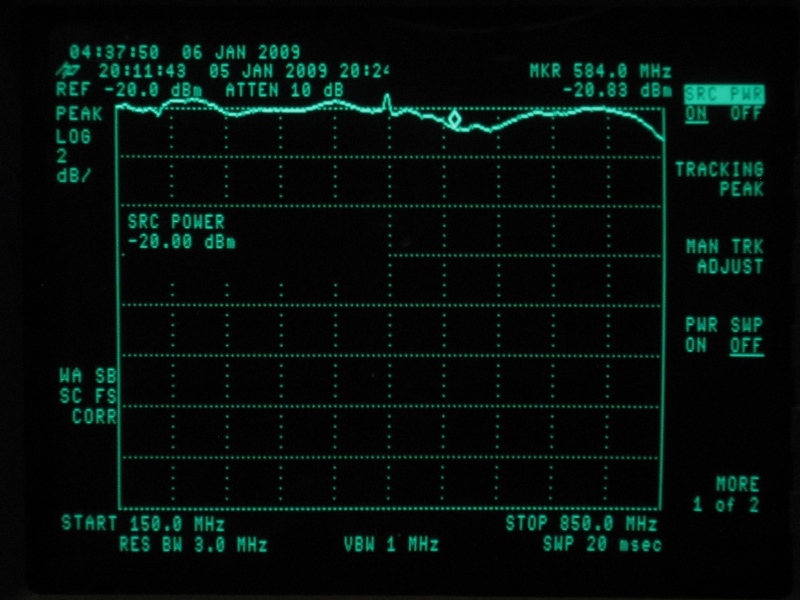
The START frequency of 150MHz was chose to include the High VHF band in the comparison, and 850 MHz for the STOP frequency just to be able to observe high end roll off. Although that makes for a span of 700 MHz, and a rather unfriendly Span/Division of 70MHz, note that the center frequency is 500MHz. As further calibration note that the High VHF Channels (174-216 MHz) are within the first minor division, Ch 19 is at the center minor division (5th), Ch 30 at the 6th, Ch 42 at the 7th, Ch 54 at the 8th, and Ch 65 at the 9th.
The lack of flatness here is attributed to imperfections in the TG Output, Analyzer Input, cables, and/or adapters. [This HP8590B includes a 75 ohm impedance option, which is convenient for VHF/UHF work. However, the physical inputs/outpus are presented on BNC connectors, thus requring adpaters, and thus additional opportunities for imperfections]. The cable is Eagle Aspen 39B2 which has losses of 3.73 dB and 6.05 dB per 100' at 400MHz and 700MHz, respectively.
Acknowledging these imperfections, note the difference in input/output signals is going to be compared, and these +/- 1dB anomolies will cancel out.
Splitter Output Level
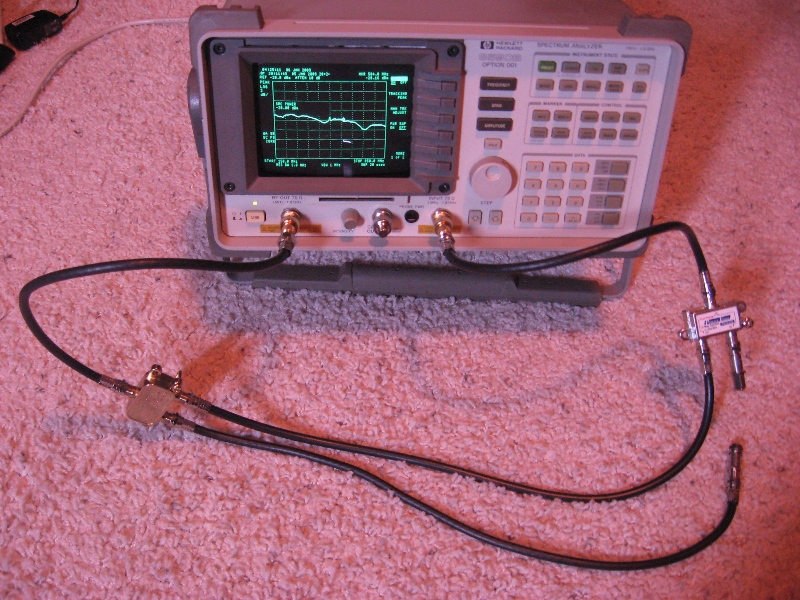
The following interconnection is used to establish the baseline RF levels that are available at the splitter output ports.
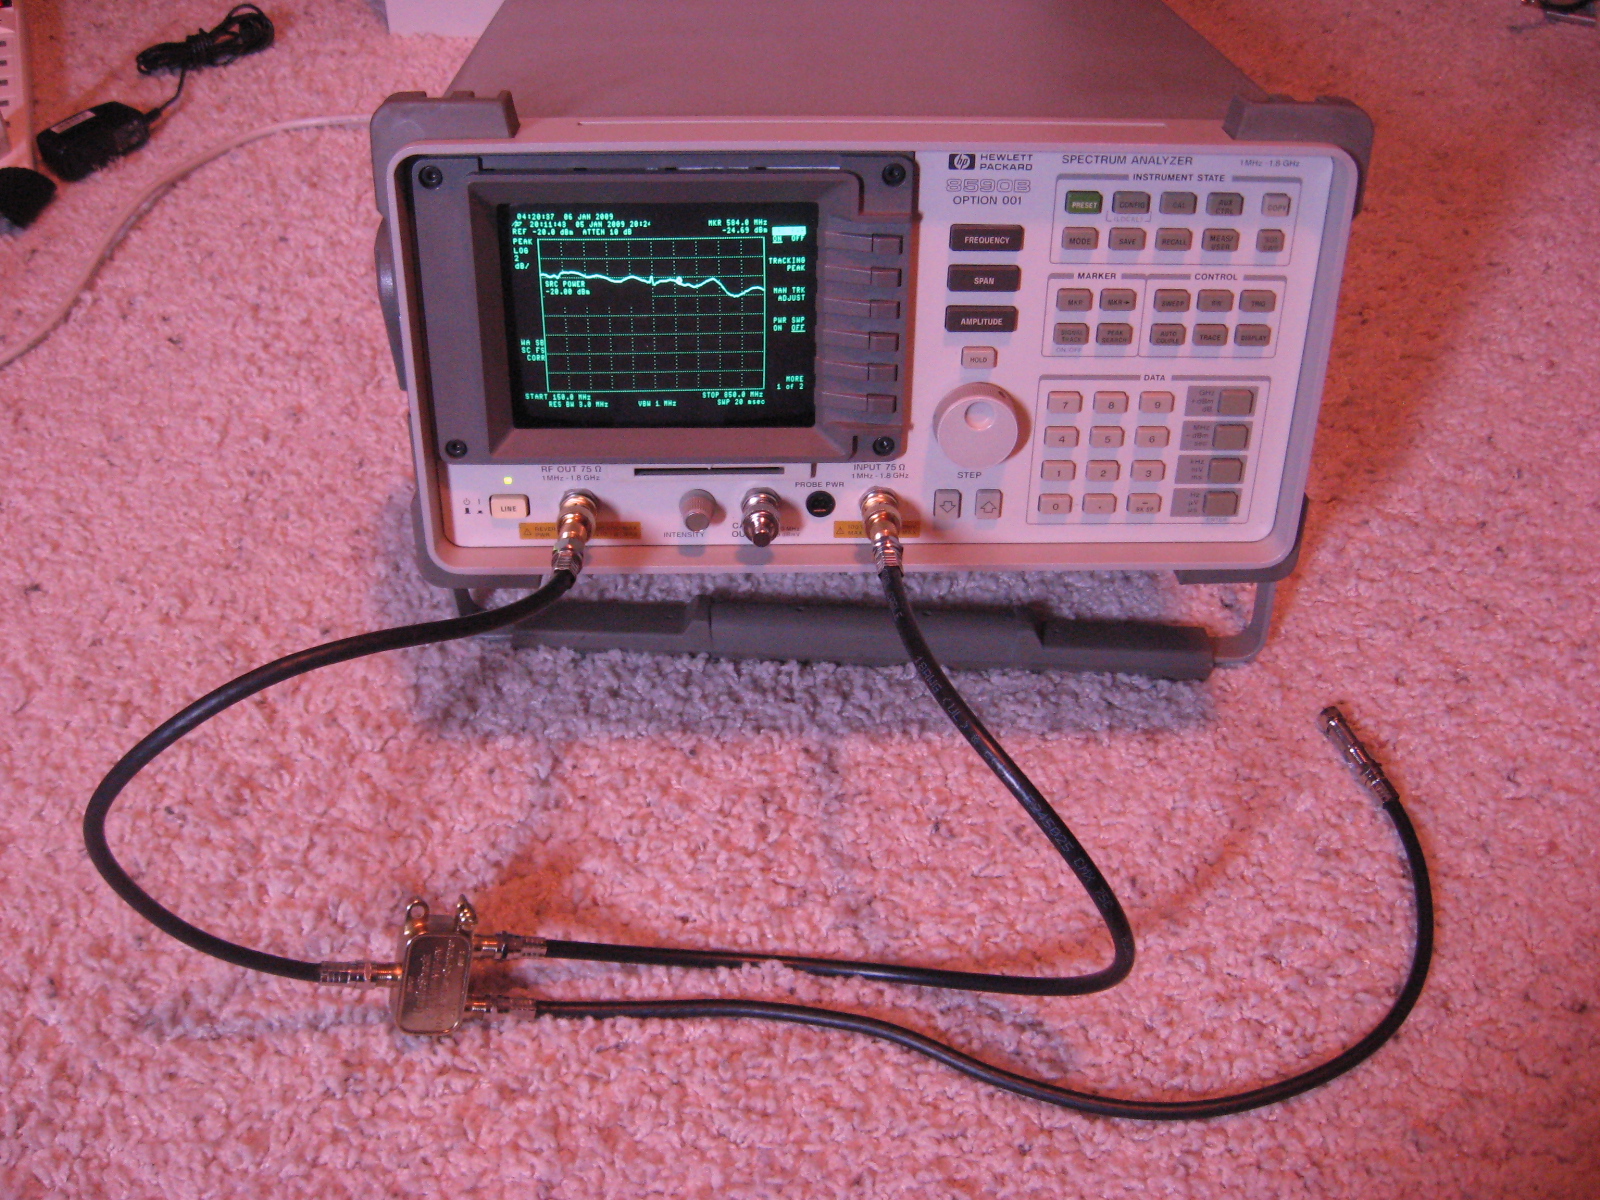
The TG Output is connected to the "In" port of the splitter. The goal is really to establish a trace of the RF level that will be available at the input ports of the combiner, and that will be partially dependent on the length of cable between antenna and combiner. We're going to use two equal length (approx 19") cables to represent those input feedlines, and because there is interaction between splitter ports, both cables are connected to the splitter and terminated. E.g., the unconnected cable is terminated with a 75 Ohm terminator.
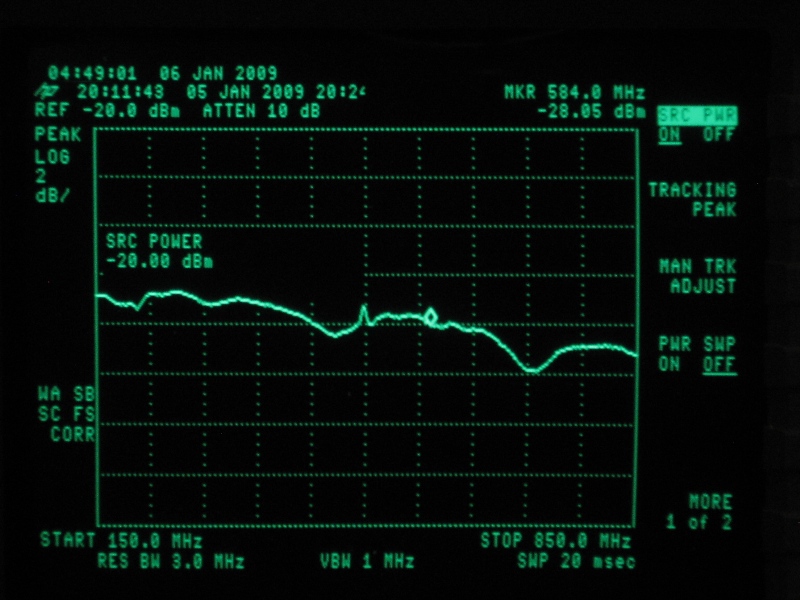
Here is a close up of the analyzer trace.
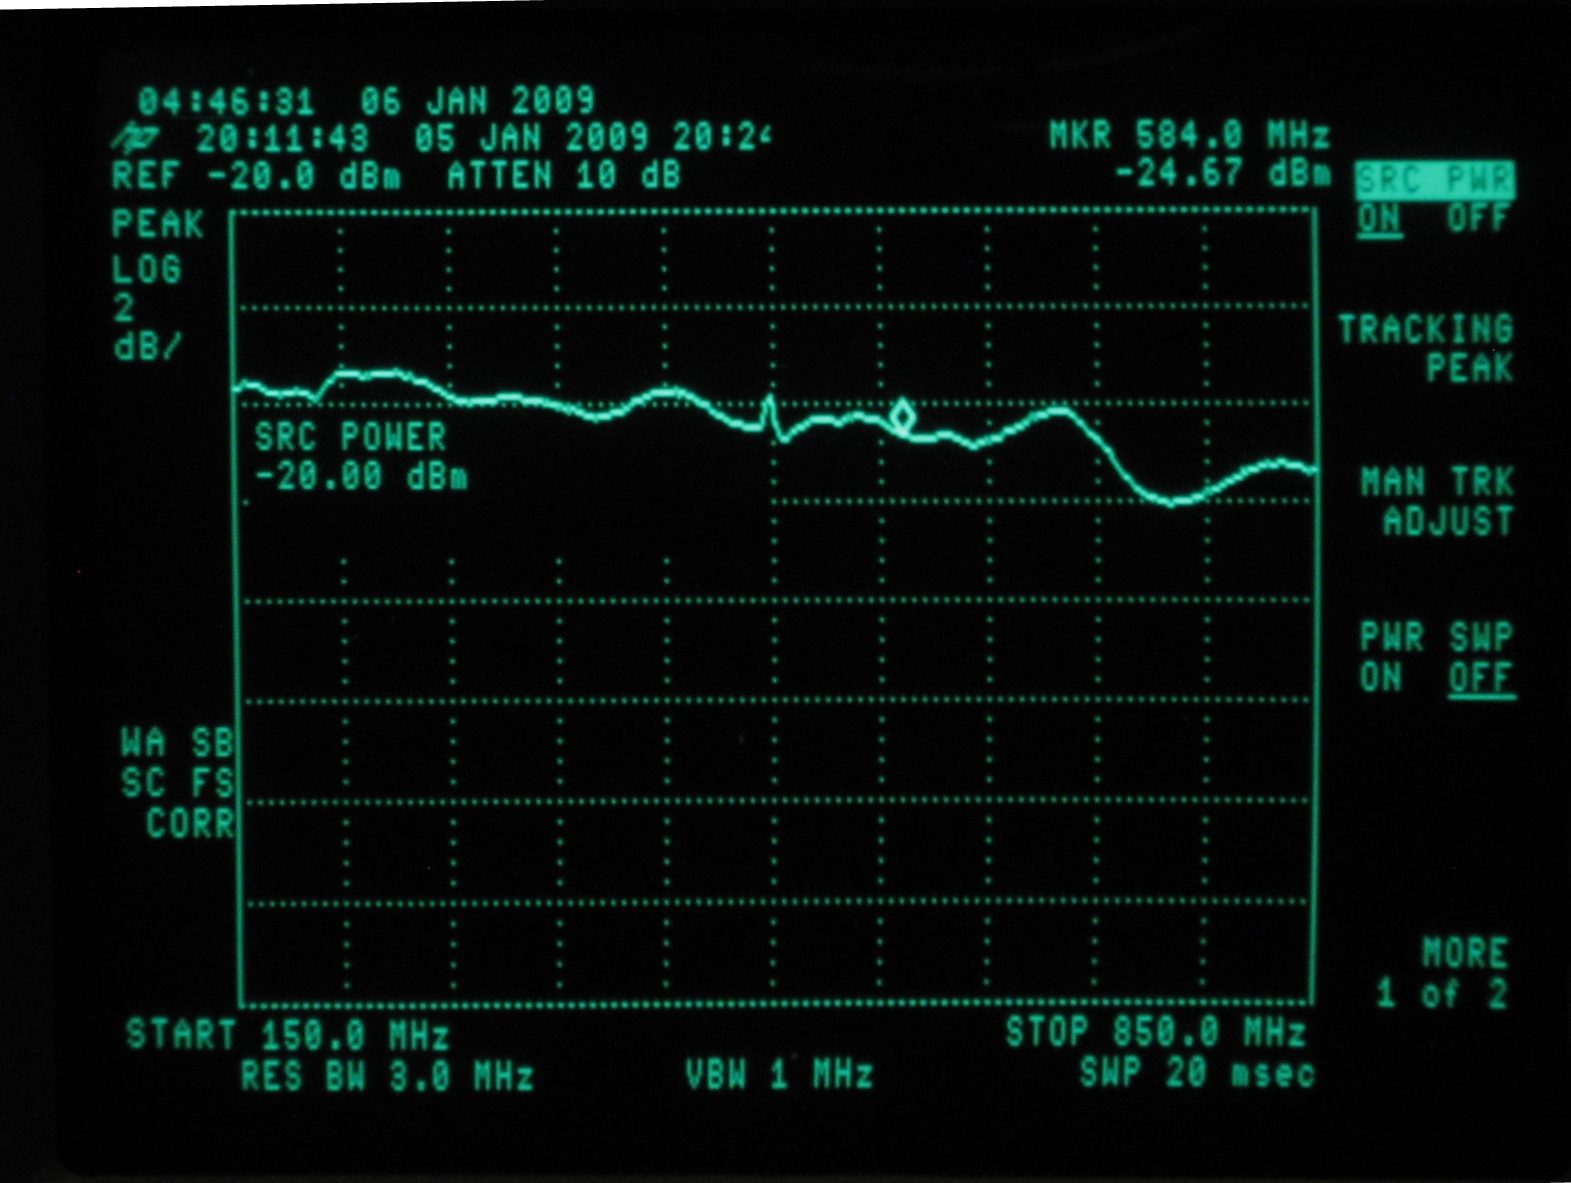
Note the Marker display; the frequency 584MHz is the (ATSC) UHF Channel 33, is roughly at the center of the UHF spectrum, just serving as a point of reference.
So these are the RF Levels that will be available at the combiner inputs. Again, I chose the Radio Shack model to put in the signal source path because it is one of the models whose output ports traces look nearly identical. E.g., at least from an amplitude perspective, we can assume this same signal to be present at both combiner inputs.
Single Source Combiner Output Level
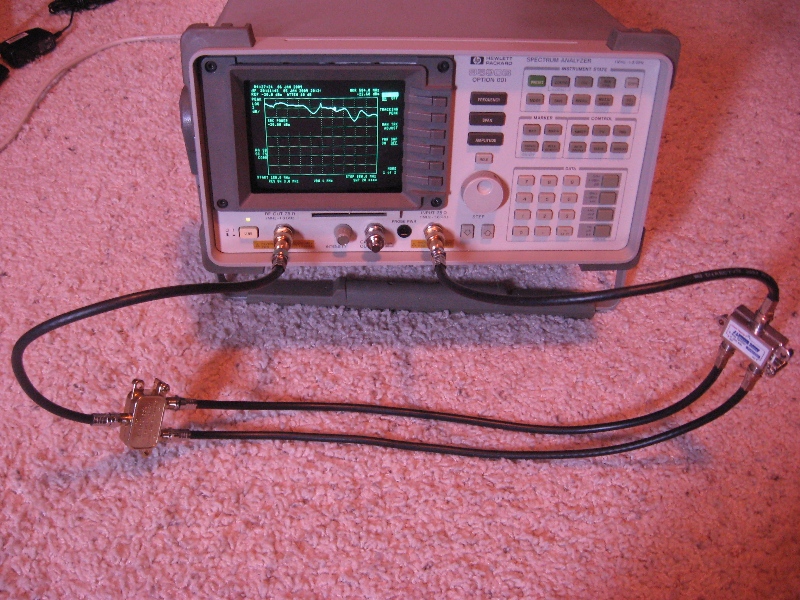
Just to understand the Device Under Test (DUT) loss, I first connect one signal source to one of its input ports. Both the unused signal source, and unused combiner input are terminated in 75 ohms.
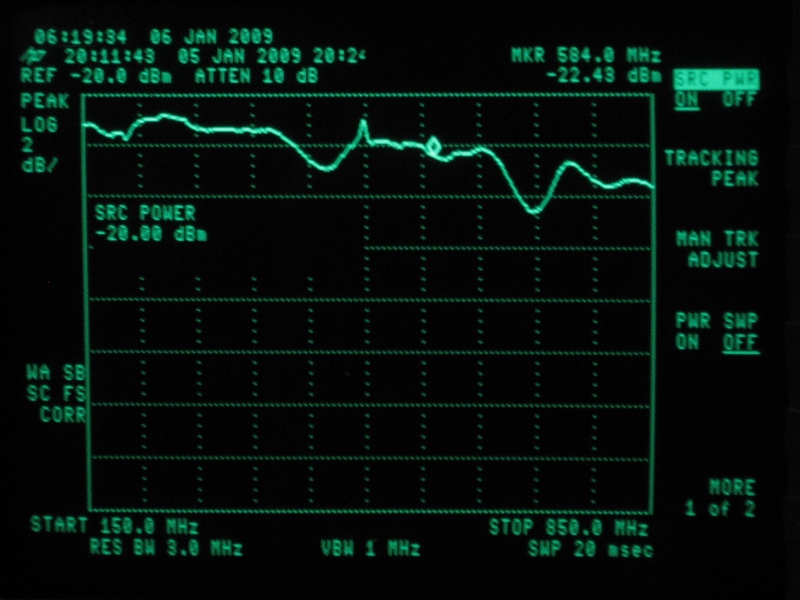
Here is a close up of the trace.
In comparison to the "Splitter Output Level" trace above, which ranges from about 4 dB to 6 dB loss, the total loss now ranges from about 7 dB at the low end to about a max of 10 dB at 710 MHz. Subtracting out the loss from the initial splitter indicates this particular combiner loss ranges from about 3dB at the low end to about 4 dB at the high end. The splitter being used as the combiner in this trace is a Perfect Vision PV22-233, one of the better ones I've measured.
Dual Source Combiner Output Level
And now for the punch line. Here is the setup with both sources attached.
Note, again, that I've taken care to insure equal length cables from source (antenna) to combiner. They are within .1".
And here is the trace.
So you can more easily compare it to the combiner input, here is a view with simultaneous input and output trace. The lower trace is the "Splitter Output Level" trace above. That is the signal presented to both input ports of the combiner, and the upper trace is the output. [Note, to be clear, for this combiner applications, by "input" I mean the ports normally labelled "Out", and by "output" I mean the common and normally labelled "In" port.
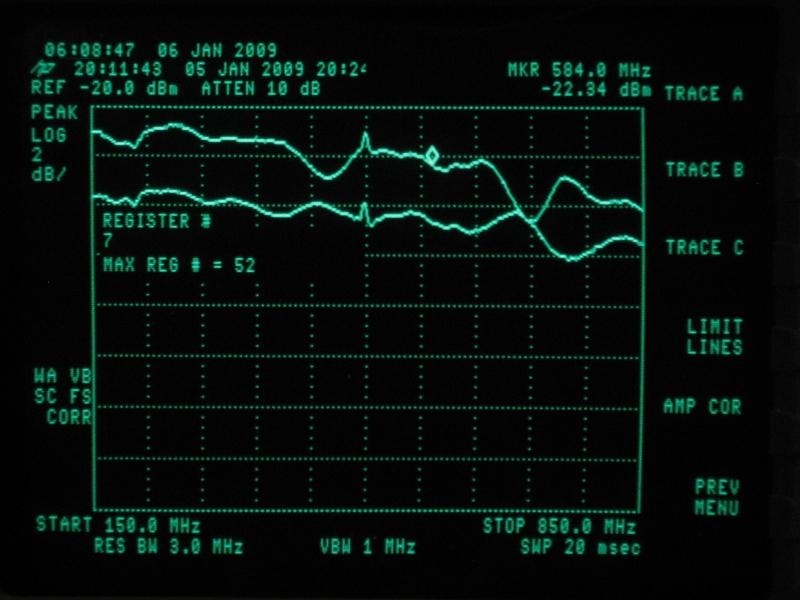
So here you have it. The peak increase in output signal occurs at about 750 MHz, and actually approaches 3dB. The minimun occurs at about 700 MHz, where it is 0, and that's Ch 52.
So if you happened to use this particular splitter as a combiner, used exactly 19" of 39B2 cable between antenna outputs and combiner input, and were targeting Ch 52, you'd have done a lot of work for nothing.
By experimentation, however, it is possible to vary the difference in interconnecting cables, and move that null (at 700MHz) somewhere else. It is also possible to play with varying just one cable. For example, replacing one of the cables of this setup with one 2.5" longer removes that null altogether.
Conclusion
Combing antennas with ad hoc and uncharacterized components and cable lengths is going to be pretty much hit or miss. At the link below I've placed screen shots for several different splitters used as combiners.
Combiner Comparison